Technology forecasting is a systematic process used to predict the future development, adoption and impact of technologies. Various methods and techniques are employed to anticipate technological trends, thereby helping organizations make informed decisions and plan for the future.

Page contents
ToggleOverview of technology forecasting methods
Extrapolation of Trends: This method is about extending current trends into the future. It is based on the assumption that historical patterns will continue, providing a direct means of projecting future developments. Although simple and easy to apply, especially when historical data is reliable, this method assumes a linear progression, which may not capture sudden disruptions or paradigm shifts.
Expert Opinion and Delphi Method: This approach involves gathering opinions from experts in the field. The Delphi method iteratively collects and synthesizes expert opinions to converge on a consensus forecast. It leverages expert insights, which is particularly useful for emerging technologies with little historical data. However, it remains vulnerable to bias, and the quality of forecasts depends on the expertise and diversity of the experts involved.
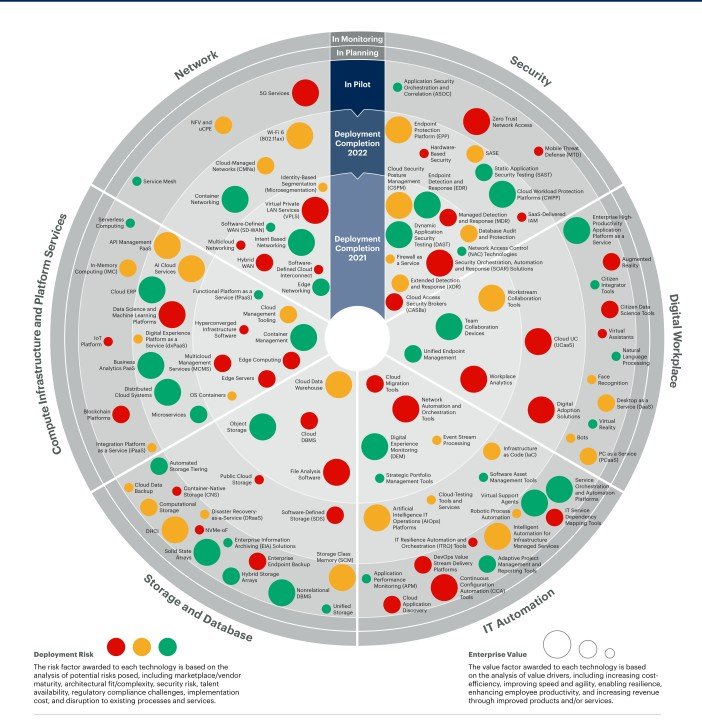
Technology Roadmap: This strategic planning tool provides a visual representation of how technologies evolve over time. It identifies key milestones, dependencies and potential future developments. It helps align technology development with organizational goals, promoting strategic planning. However, it may struggle to take into account unpredictable external factors and disruptive innovations.
Cross Impact Analysis: This approach examines the relationships and interactions between different factors to identify the potential impact of changes in one area on others. Often used to assess the implications of multiple technological developments, it provides a more nuanced understanding of the interdependencies between factors. Its complexity increases with the number of factors considered, and its accuracy depends on the quality of the data.
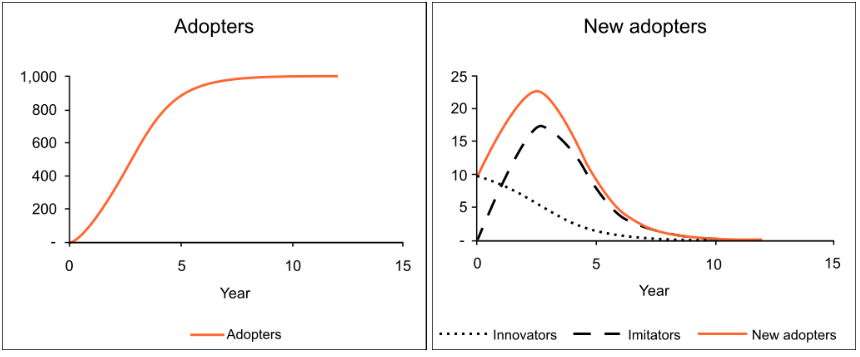
Bass Diffusion Model: Mainly used to predict the adoption of new technologies in a market, this model considers the influence of innovators and imitators in the diffusion process. It is useful for estimating adoption patterns and market saturation, but relies on assumptions about the influence of different categories of users.
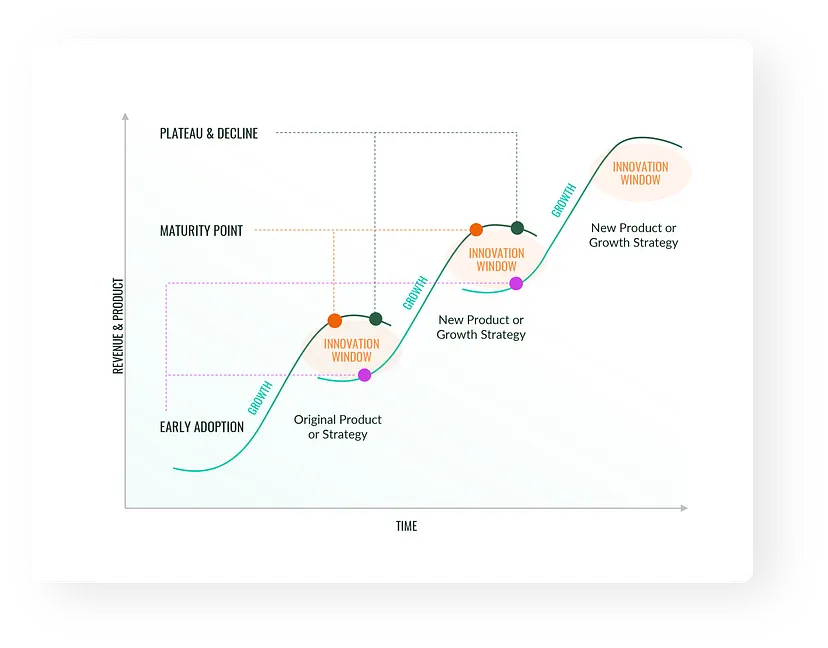
Technology S-Curve Analysis: This method examines the life cycle of a technology, depicting its growth, maturity, and eventual decline. It helps understand the pace of adoption and potential for disruptive technologies. It provides insights into the technology's trajectory and saturation point, but assumes a predictable life cycle, which may not hold for rapidly evolving technologies.
Agent-Based Modeling: Involves simulating the interactions of individual agents or entities within a system to observe emerging patterns. Used to understand complex systems and predict their behavior, this method makes it possible to model complex interactions and nonlinear dynamics. However, it requires detailed data and computational resources, and accuracy depends on the fidelity of the model to real-world dynamics.
Extrapolation of trends
Trend extrapolation is a widely used method for predicting future developments. By leveraging historical data, it assumes that existing trends and growth rates will continue in a predictable manner. Essentially, trend extrapolation involves projecting the current trend into the future.
Although this method is simple and offers valuable information for short-term forecasting, it also attracts its share of criticism, especially when applied to long-term forecasting. This analysis delves deeper into the intricacies of trend extrapolation, examining its methodologies, applications, benefits and limitations.
At its core, trend extrapolation is about extending current data trends into the future. It is based on the idea that patterns persisting in historical data can provide insight into future behavior. This method is typically applied using statistical tools and techniques to derive future values based on historical patterns.
Linear extrapolation assumes a constant growth rate, making it suitable for forecasting events in the near future where substantial changes in the growth rate are unlikely. Nonlinear extrapolation, on the other hand, recognizes that growth rates can change and is often used in scenarios with cyclical trends or known factors that could affect growth.
Many trends, especially in industries like retail or tourism, have seasonal components. Adjusting for seasonality involves identifying and accounting for these repeated fluctuations, ensuring that the extrapolated trend is not falsely representative due to seasonal variations.
Modern trend extrapolation often involves software solutions capable of processing large amounts of data and using advanced algorithms to predict future values. Time series analysis, regression models, and machine learning can help refine extrapolated forecasts.
Trend extrapolation is a fundamental tool in the world of forecasting, providing a simple approach to predicting future developments based on historical patterns. Its simplicity, cost-effectiveness and reliability for short-term forecasting make it a preferred choice by many professionals in various sectors.
However, its inherent assumptions and potential pitfalls require a balanced approach, often combining it with other forecasting methods to obtain a more complete picture. In an age where data drives decisions, trend extrapolation remains a crucial analytical tool. However, as with any method, its effective use requires understanding its strengths, its limitations and the context in which it is applied. In the ever-changing landscape of the modern world, a blend of historical data, advanced analytical tools and expert knowledge ensures that we approach the future with caution and foresight.
Expert Opinion and Delphi Method
A first questionnaire, containing a very general question, is sent to all the experts. They must then return it completed to the team of researchers who will construct the following questionnaire based on the answers obtained in the first. The process continues until the team reaches significant consensus on the answers. Three questionnaires are generally sent.
The Delphi survey then generally follows various stages:
1. Form a team (steering group) to undertake and monitor the Delphi survey. The steering group will also delimit the study area Identification and formulation of the problem under study
2. Experts (or key informants) are selected, the group of experts can range from 5 to 15 people
3. The 1st round questionnaire is developed and sent to interested parties after having been tested (to remove ambiguities, inaccuracies, etc.)
4. The completed questionnaires are processed and the responses analyzed: statistics are developed or content organized
5. A 2nd questionnaire is created with new questions which allow you to explore the theme in greater depth or to verify it. The second questionnaire is used to clarify, modify or even justify the experts' initial judgment. this questionnaire is sent again
6. Completed questionnaires are processed. Statistics or thematic categories are developed, based on the responses
7. When consensus is reached or saturation is reached, the process stops. Generally, this consensus is found after three questionnaires
8. Once consensus is found or saturation is reached, a final results report is prepared by the steering group and sent to the applicant.
The first questionnaire includes a rather general question, which allows experts to express themselves generally. The purpose of the second questionnaire is to review the priorities defined in the first, to clarify them and to classify them in order of importance. These responses are then summarized and returned to the experts in a third questionnaire. They must then take a position in relation to the reformulated answers. The process usually stops at this point. A consensus around the questions to be developed is then found.
One of the advantages of this method is being able to work with geographically dispersed experts without there being any influence between them. It avoids the effects of influence that can be created during face-to-face meetings with experts and guarantees anonymity.
Technology roadmap
A technology roadmap helps teams document the rationale for when, why, how, and what technology solutions can help the business move forward.
From a practical perspective, the roadmap should also outline what types of tools are best to spend money on and the most effective way to introduce new systems and processes.
The roadmap can also help you connect the technology the company needs with its long- and short-term business goals at a strategic level.
A technology roadmap typically includes:
Company or team goals
New system capabilities
Release plans for each tool
The steps to achieve
The necessary resources
The necessary training
Potential risk factors or barriers to consider
Status Report Reviews
Multiple teams and stakeholders are typically involved in the technology roadmap, from IT to general managers, product, project, operations, engineering, finance, sales, marketing and legal aspects.
The roadmap helps everyone align and understand how different implementation tasks and responsibilities impact their productivity.

Cross Impact Analysis
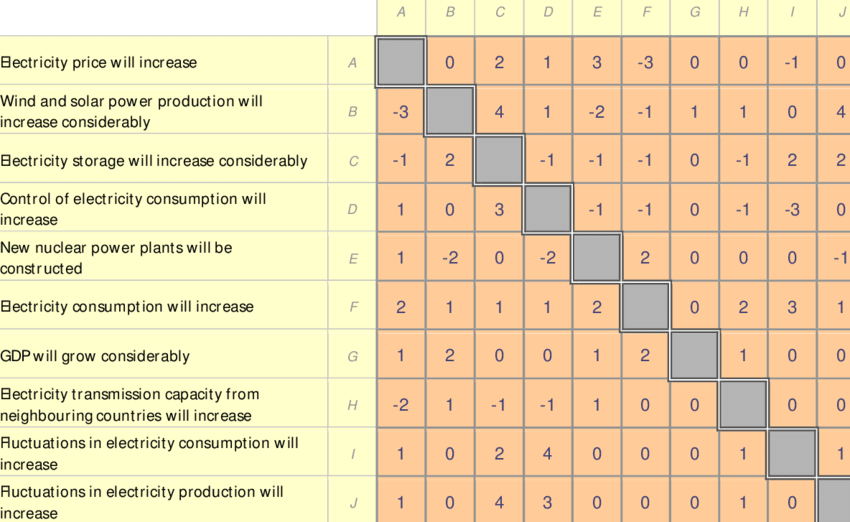
Cross-impact analysis is the general name given to a family of techniques designed to assess changes in the probability of occurrence of a given set of events following the actual occurrence of one of them . The cross-impact model was introduced as a way to account for interactions between a set of forecasts, when these interactions may not have been considered when developing individual forecasts.
Cross-impact analysis is primarily used in foresight and technology forecasting studies rather than in foresight exercises per se. In the past this tool was used as a simulation method and in combination with the Delphi method.
The steps described in this section are valid for different variations of the cross-impact analysis. The steps necessary for implementing the SMIC method (developed in France in 1974 by Duperrin and Godet), which is based on dedicated software, are described here.
The list of events to study can also be established with the support of experts on the selected issue, or can come from other methods used to gather opinions, such as the Delphi method.
Design of the probability scale and definition of the time horizon: The definition of a probability scale is necessary to translate experts' qualitative assessment of the degree of occurrence (e.g. most likely, most likely, etc.) into probabilities. In general, the probability scale for cross-impact methods typically ranges from 0 (impossible event) to 1 (almost certain event).
Estimation of probabilities: in this step, the initial probability of occurrence of each event is estimated. Next, the conditional probabilities in a cross-impact matrix are estimated in response to the following question: "If event x occurs, what is the new probability of event j occurring?" The entire cross-impact matrix is completed by asking this question for each combination of occurrence event and impacted event. The aim of the SMIC is to enable the consistency of expert estimates to be verified. The SMIC method invites experts to answer a grid to the following questions:
• the probability of occurrence of each unique event at a given time horizon
• the conditional probabilities of the separate event taken in pairs at a given time horizon:
• P (i/j) probability of i if j occurs
• P (i /not j) probability of i if j does not occur
Generation of scenarios: THE result of the application of a cross-impact model is a production of scenarios.
Regardless of how the question of probability assignment is resolved in specific cross-impact models, the usual procedure is to perform a Monte Carlo simulation (Martino and Chen, 1978). Each run of the model produces a synthetic future history, or scenario, that includes the occurrence of certain events and the non-occurrence of others.
The model is therefore run enough times (around 100 in the SMIC version) so that all of the output scenarios represent a statistically valid sample of the possible scenarios that the model could produce.
In a model with n events, possible scenarios “2 to the power of n” are generated, each different from all the others by the occurrence of at least one event. For example, if there are 10 events to consider, there are 1024 possible scenarios to estimate.
Once the cross impact matrices have been calculated, it is possible to carry out a sensitivity analysis. Sensitivity analysis involves selecting an initial probability estimate or a conditional probability estimate, over which uncertainty exists. This judgment is modified and the matrix is re-executed. If significant differences appear between this analysis and the original one, then it appears that the modified judgment plays an important role. It might be worth reconsidering this particular judgment.

Bass Broadcast
The Bass model or Bass diffusion model was developed by Frank Bass. It is a simple differential equation that describes the process by which new products are adopted by a population. The model presents a rationale for how current adopters and potential adopters of a new product interact. The basic principle of the model is that adopters can be classified as innovators or imitators, and that the speed and timing of adoption depends on their degree of innovation and the degree of imitation among adopters.
The Bass model has been widely used in forecasting, especially in new product sales forecasting and technology forecasting. Mathematically, the basic Bass diffusion is a Riccati equation with constant coefficients equivalent to the Verhulst-Pearl Logistic growth.
In 1969, Frank Bass published his article on a new growth model for consumer durable products. Previously, Everett Rogers published Diffusion of Innovations, a highly influential book describing the different stages of product adoption. Bass brought some mathematical ideas to the concept. While the Rogers model describes the four stages of the product life cycle (Introduction, Growth, Maturity, Decline), the Bass model focuses on the first two (Introduction and Growth). Some Bass-Model extensions present mathematical models for the last two (maturity and decline).

S-curve
If you look at all the technological revolutions of the last few decades, you will find that they all tend to follow a similar behavior, called curve in S.
- At the beginning, technology proves expensive, bulky and poorly adopted . Improvements seem slow as fundamental concepts are understood (think of the first automobiles, for example. Development began in 1672, and it wasn't until 1769 that the first steam-powered automobile capable of transporting humans was created.).
- Then there is usually a period of rapid innovation and feature expansion, driving mass adoption (this is when engines and cars became better and cheaper, more attractive than a horse and cart and almost everyone bought one).
- Then, as the market matures, significant improvements tend to slow down and there aren't many new customers to sell to. We have reached the peak of the S-curve which is saturated.
Now a whole new technology with its own S-curve can take over . This is seen in cars (emergence of electric vehicles), planes or other inventions.

Agent Modeling
Creating digital twins using multi-agent modeling is very complex. We invite you to view our course on Multi-Agent on our site complex-system-ai.com